Evidence
Bring back proof, not a claim: screenshots that carry their own provenance, logs narrowed to your app and a report of every step.
Try it autonom screenshot
Needs a session on one target
How it works
Autonom climbs an evidence ladder: code, then unit and widget tests, then an integration run on one target, then screenshot, tree and logs, then profile, memory and network, and last a before and after replay. Climb it; do not skip a rung.
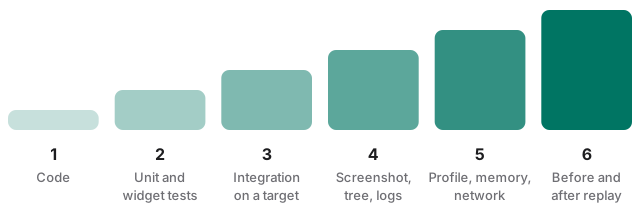
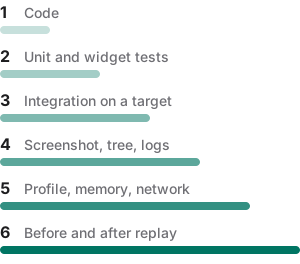
Every capture lands in the session’s folder, and every command goes into its journal, failures included. A screenshot carries its own provenance: the session, target, app, label and the number of active mock rules are written into the PNG and into an index.
Two captures of the same screen can still differ by the battery glyph, the signal bars, a half-finished animation or an autocorrected word. Pins fix what the app does not own, so a before and after diff shows only what the app changed. The clock stays real unless you pin it on purpose.
Examples
Every output below comes from Autonom’s test device, so you can run the same commands without an emulator. Open Reproduce these outputs at the end for the exact script.
Capture a screen that never lands mid-animation
Goal: take a screenshot you can compare with tomorrow’s.
- Pin the status bar.
Full battery and signal, no notification icons, the real clock.
autonom simulator status-bar pin - Turn system animations off.
This is Android only; iOS has no switch for it.
autonom simulator animations pin - Wait for a still screen.
Two trees in a row must match.
autonom ui wait --settled --timeout-ms 5000 - Take the screenshot.
Take it only once the wait reports
settled: true.autonom screenshot - Turn animations back on.
Each undo restores what the pin replaced.
autonom simulator animations reset - Unpin the status bar.
The device shows its real state again.
autonom simulator status-bar clear
You should see the pin confirmed by reading the battery back, with a warning about the signal bars.
What to look at. verified rests on a read-back, and verified_keys names what was read: the battery. The signal bars cannot be read back from the Mac, so they carry signal_unstable instead of a claim.
Show full output
Keep a mocked screenshot out of the proof
Goal: tell a capture of the real server from one taken while a mock rule could shape the screen.
- Take a labeled capture.
The label goes into the PNG with the session and target.
autonom screenshot --label "after login" - Add a mock rule.
It makes the login request fail, as in Force a backend failure.
autonom network mock add --url '.../v1/login' --status 500 --json '{"error":"x"}' - Capture again.
Group it under a task, so you can find it later.
autonom screenshot --task login --label "500 error state" - Switch the rule off.
Rules persist, so do not leave one on by accident.
autonom network mock disable --all
You should see one active rule and a screenshot_shows_mocked_data warning on the second capture.
What to look at. The second capture says a rule was active, and the same fact is written into the PNG and the index. shots list --mocked-only finds it later, so it never passes for the real server’s behavior.
Read a failed run as a report
Goal: turn a failed flow run into a report you can read and hand off.
- Run the flow.
A flow keeps evidence for every step it runs; name your own flow file or folder in place of this one.
autonom flow run flows/sign-in.yaml - Build the report.
One command writes the HTML report, a JUnit file and a bundle you can hand off.
autonom report build
You should see status: failed and where the HTML report, the JUnit file and the bundle were written.
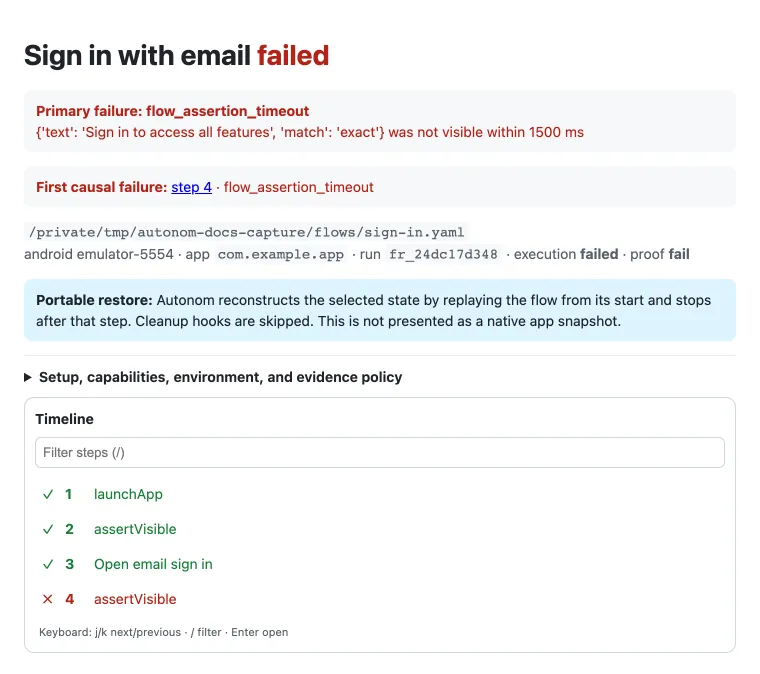
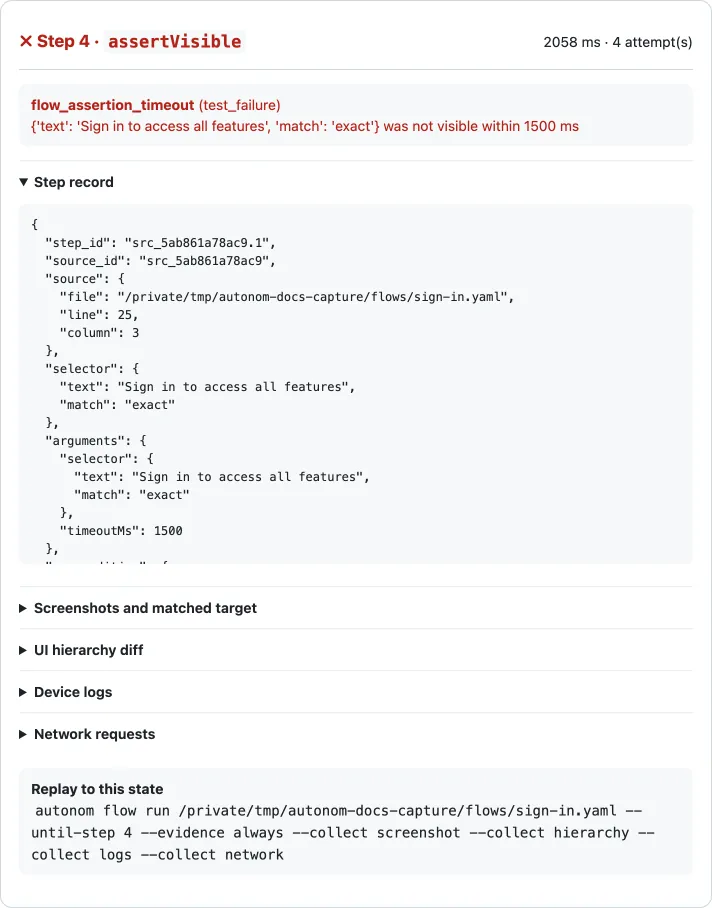
What to look at. The report names the first failure that caused the others and links to its step. That step gives the file, line and column, the evidence Autonom kept and the command that replays the flow up to that point.
Explain a crash with the app’s logs
Goal: save the app’s recent logs into the session and find the line that explains the failure.
- Read the app’s recent logs.
--packagenarrows the device log to your app.autonom logs tail --package com.example.app --since 60 - List crash reports.
On Android they come from the crash log buffer, on iOS from idb’s crash store.
autonom crash list
You should see five lines: three from your app, the fatal exception among them, and two system lines that start and end its process. Then comes the filter Autonom used.
What to look at. filter is uid: on API 31 and later Autonom keeps the lines your app’s user id logged, plus the system lines that start or end its process. Another app’s lines never leak in.
Show full output
Reproduce these outputs
From the root of an Autonom d0f7211 checkout, in bash or zsh. The target is Autonom’s own test device on its Yarn Shop sign-in screen; the log lines and app ids come from Autonom’s own tests. Ids, times and paths differ on every run. The report screens come from the same flow run.
Good to know
- Exit 0 is not proof. A tap that returns ok has not been shown to do anything. Compare before and after trees or screenshots; the change is the proof.
- Pin before the first capture you mean to compare. Otherwise the battery glyph and the signal bars show up as a difference the app never made.
hhmm=0941freezes the clock through demo mode; use it only when a fixed time matters more. - Take evidence with
autonom screenshot, not a raw screen capture. An emulator’s bars and battery drift within a minute of a pin, and Autonom sends the pin again right before every screenshot and flow capture. - Never present a mocked screenshot as the server’s behavior. A capture taken while a rule is active carries
screenshot_shows_mocked_datain its output, its PNG and the index. - A weaker log filter says so. Below API 31, Autonom narrows logs to the app’s running process. If the app is not running, or the API level cannot be read, it keeps only lines that name the app.
filterthen readspidornone, with alog_filter_degradedwarning, instead of passing the whole device log off as your app’s. - State the coordinate space.
widthandheightcome from the PNG. On iOS that is pixels, while the tree andui tapspeak points. - A failed crash listing is an error, not an empty list. On iOS, when idb has lost its companion,
crash listfails instead of answering with no crashes. - Every live follow is bounded.
logs followstops at--max-secondsor--max-lines. - Treat the session folder as sensitive. It can hold screenshots, logs, pulled files and captured requests. It lives outside any repository; delete it when the investigation ends.
Reference
Each command acts on the session’s one target and prints JSON.
| Command | What it does |
|---|---|
autonom screenshot | Captures the screen with its provenance in the PNG. --label names it; --task groups it. |
autonom shots list | Lists the session’s screenshots from the index; --mocked-only keeps those taken under a rule. |
autonom shots show <path> | Shows one screenshot’s provenance and size. |
autonom record start | Starts recording the screen into the session; record stop ends it. |
autonom logs tail | Reads recent device logs. --package narrows them to one app and names the filter it used. |
autonom logs follow | Prints new log lines as they arrive, until --max-seconds or --max-lines. |
autonom crash list | Lists crash reports; crash show opens one. |
autonom simulator status-bar <action> | pin sets full battery and signal and hides notification icons, with the real clock; clear restores. |
autonom simulator animations <action> | Android: pin sets the three animation scales to 0; reset restores them. |
autonom simulator keyboard <action> | iOS: pin turns autocorrect, prediction and auto-capitalization off and sets a locale; reset restores. |
autonom ui wait --settled | Waits until two trees in a row match; exits 1 when the screen never settles. |
autonom report build | Builds the HTML report, the JUnit file and the bundle of a flow run. |
autonom note add <text> | Adds a note to the journal. |
autonom journal | Reads the session’s timeline back: every command, its scrubbed arguments and the result. |
Android and iOS differences
Logs are partial on both: Autonom narrows them to one app and says how.
| Capability | Android | iOS Simulator |
|---|---|---|
| Screenshot | Yes | Yes, even without idb |
| Status bar pin | Yes; the signal is not read back | Yes, read back |
| System animations off | Yes | No |
| Keyboard and locale pin | No: the settings live in Gboard | Yes, on a shut-down Simulator |
| Logs | Partly: by user id on API 31 and later | Partly: by the app binary’s UUID |
| Crash reports | Partly: the crash log buffer | Yes: idb’s crash store |
| Screen recording | Yes | Yes |
On API 36 emulators the system UI may not draw the battery glyph at all, even when the pinned level is reported. A missing icon in a capture is the emulator’s.
Next steps
You can bring back screenshots, logs and a report that prove what the app did.