Performance and memory

Measure memory, CPU, frames and traces on the session's device, and tell a growth lead from a real leak.

Try it autonom metrics snapshot --label baseline

Needs a session on one target · Autonom installed

How it works

The autonom metrics commands measure the app on the session's target and print JSON. Each one saves its raw output in the session's metrics folder, beside the session's other evidence. Each one also adds a line to the session journal.

A single number proves little. Memory that keeps rising is a growth lead, not a leak. A leak needs an object that stays in memory with a path to a root, or growth that repeats under the same flow.

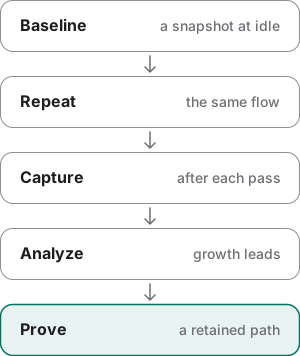
Five steps in a row: a baseline at idle, the same flow repeated, a capture after each pass, an analysis for growth leads, and last, proof of a retained path. Five steps in a row: a baseline at idle, the same flow repeated, a capture after each pass, an analysis for growth leads, and last, proof of a retained path.
Growth is a lead. Only a retained path proves a leak.

Each platform has its own sources. Android reports through dumpsys meminfo, /proc, gfxinfo and simpleperf. The iOS Simulator runs on your Mac, so it reports through the Mac's ps, the app container's size and Instruments. Every snapshot names its source in metric_semantics.

Five skills tell your agent how to read these numbers. Its project router loads the ones your stack needs.

  • android-runtime-performance: one flow on one device, with Macrobenchmark, Perfetto, Simpleperf or gfxinfo.
  • flutter-performance-audit: build cost apart from raster cost, in profile mode.
  • compose-performance-audit: recomposition, stability, lazy keys and layout work.
  • android-memory-leaks and flutter-memory-leaks: growth as a lead, then the retaining path.

Examples

Every output here comes from Autonom's test device, so you can reproduce it without an emulator. The commands are in Reproduce these outputs, after the examples.

Take a baseline before you change anything

Goal: record the app's memory and CPU at an idle screen you can return to.

  1. Take a labeled snapshot.

    Run it on an idle screen. The label names the files it saves.

    autonom metrics snapshot --label baseline

You should see the app's memory in kilobytes, with a line that names what was measured.

{ "ok": true, "platform": "android", "pid": 4242, "metric_semantics": "android_dumpsys_meminfo_v1", "memory": { "total_pss_kb": 9000, "total_rss_kb": 15000, "java_heap_kb": 4000, … }, …

What to look at. metric_semantics says these are Android meminfo figures. An iOS snapshot measures something else, so never compare the two.

Show full output
{ "ok": true, "platform": "android", "pid": 4242, "metric_semantics": "android_dumpsys_meminfo_v1", "memory": { "total_pss_kb": 9000, "total_rss_kb": 15000, "java_heap_kb": 4000, "native_heap_kb": 2500, "graphics_kb": 1000, "private_other_kb": 500, "system_kb": 1000, "activities": 1, "views": 20, "view_root_impl": 1, "app_contexts": 3, "webviews": 0 }, "cpu": { "available": true, "process_percent": 12.5, "note": "dumpsys cpuinfo figure averaged over 10000 ms that ended 0 ms before this snapshot; use a series under a fixed flow for claims" }, "proc": { "threads": 42, "vm_rss_kb": 8500, "vm_size_kb": 120000 }, "limitations": [], "cpu_sampling": { "source": "dumpsys_cpuinfo", "scale": "percent_of_one_core", "stale_after_ms": 5000, "fresh_sample_error": "/proc/4242/stat and /proc/stat were not readable as stat lines", "cpu_window_ms": 10000, "cpu_window_age_ms": 0, "stale": false }, "captured_at": "…", "app_id": "com.example.app", "artifacts": [ "/tmp/autonom-perf/.autonom/sessions/s_…/metrics/…-baseline-snapshot.json", "/tmp/autonom-perf/.autonom/sessions/s_…/metrics/…-baseline-meminfo.raw.txt" ], "target_id": "emulator-5554", "serial": "emulator-5554" }

Check whether memory grows across a repeated flow

Goal: tell steady growth from a one-time spike.

  1. Take a baseline.

    Start from an idle screen you can return to.

    autonom metrics snapshot --label baseline
  2. Repeat the flow and capture.

    Run the same flow, return to the same screen, then capture. Do this at least three times.

    autonom metrics memory capture --label after-flow
  3. Analyze the captures.

    It reads every capture in the session's metrics folder.

    autonom metrics memory analyze

You should see the metrics that grew listed as leads, and a reminder that a trend is not a leak.

{ "ok": true, "sample_count": 3, "metrics": {…}, "directional_growth_leads": [ "java_heap_kb", "total_pss_kb", "total_rss_kb" ], "interpretation": "Directional trend only. A leak requires a retained object/root path or a repeatable accumulation pattern under an equivalent flow.", "samples": […] }

What to look at. The Java heap grew 1400 KB, so it is a lead. The native heap grew 600 KB, under the 1024 KB threshold, so it is not. Open the full output to see both. A lead tells you where to look; a heap dump's retaining path proves a leak.

Show full output
{ "ok": true, "sample_count": 3, "metrics": { "activities": { "samples": 3, "first": 1.0, "last": 2.0, "delta": 1.0, "minimum": 1.0, "maximum": 2.0, "slope_per_capture": 0.5, "decreases": 0, "directional_growth": false }, "app_contexts": { "samples": 3, "first": 3.0, "last": 4.0, "delta": 1.0, "minimum": 3.0, "maximum": 4.0, "slope_per_capture": 0.5, "decreases": 0, "directional_growth": false }, "graphics_kb": { "samples": 3, "first": 1000.0, "last": 1200.0, "delta": 200.0, "minimum": 1000.0, "maximum": 1200.0, "slope_per_capture": 100.0, "decreases": 0, "directional_growth": false }, "java_heap_kb": { "samples": 3, "first": 4000.0, "last": 5400.0, "delta": 1400.0, "minimum": 4000.0, "maximum": 5400.0, "slope_per_capture": 700.0, "decreases": 0, "directional_growth": true }, "native_heap_kb": { "samples": 3, "first": 2500.0, "last": 3100.0, "delta": 600.0, "minimum": 2500.0, "maximum": 3100.0, "slope_per_capture": 300.0, "decreases": 0, "directional_growth": false }, "private_other_kb": { "samples": 3, "first": 500.0, "last": 700.0, "delta": 200.0, "minimum": 500.0, "maximum": 700.0, "slope_per_capture": 100.0, "decreases": 0, "directional_growth": false }, "system_kb": { "samples": 3, "first": 1000.0, "last": 1000.0, "delta": 0.0, "minimum": 1000.0, "maximum": 1000.0, "slope_per_capture": 0.0, "decreases": 0, "directional_growth": false }, "total_pss_kb": { "samples": 3, "first": 9000.0, "last": 11400.0, "delta": 2400.0, "minimum": 9000.0, "maximum": 11400.0, "slope_per_capture": 1200.0, "decreases": 0, "directional_growth": true }, "total_rss_kb": { "samples": 3, "first": 15000.0, "last": 18000.0, "delta": 3000.0, "minimum": 15000.0, "maximum": 18000.0, "slope_per_capture": 1500.0, "decreases": 0, "directional_growth": true }, "view_root_impl": { "samples": 3, "first": 1.0, "last": 2.0, "delta": 1.0, "minimum": 1.0, "maximum": 2.0, "slope_per_capture": 0.5, "decreases": 0, "directional_growth": false }, "views": { "samples": 3, "first": 20.0, "last": 32.0, "delta": 12.0, "minimum": 20.0, "maximum": 32.0, "slope_per_capture": 6.0, "decreases": 0, "directional_growth": false }, "webviews": { "samples": 3, "first": 0.0, "last": 0.0, "delta": 0.0, "minimum": 0.0, "maximum": 0.0, "slope_per_capture": 0.0, "decreases": 0, "directional_growth": false } }, "directional_growth_leads": [ "java_heap_kb", "total_pss_kb", "total_rss_kb" ], "interpretation": "Directional trend only. A leak requires a retained object/root path or a repeatable accumulation pattern under an equivalent flow.", "samples": [ { "path": "/tmp/autonom-perf/.autonom/sessions/s_…/metrics/…-after-flow-meminfo.txt", "metrics": { "total_pss_kb": 9000, "total_rss_kb": 15000, "java_heap_kb": 4000, "native_heap_kb": 2500, "graphics_kb": 1000, "private_other_kb": 500, "system_kb": 1000, "activities": 1, "views": 20, "view_root_impl": 1, "app_contexts": 3, "webviews": 0 } }, { "path": "/tmp/autonom-perf/.autonom/sessions/s_…/metrics/…-after-flow-meminfo.txt", "metrics": { "total_pss_kb": 10100, "total_rss_kb": 16500, "java_heap_kb": 4600, "native_heap_kb": 2800, "graphics_kb": 1100, "private_other_kb": 600, "system_kb": 1000, "activities": 1, "views": 25, "view_root_impl": 1, "app_contexts": 3, "webviews": 0 } }, { "path": "/tmp/autonom-perf/.autonom/sessions/s_…/metrics/…-after-flow-meminfo.txt", "metrics": { "total_pss_kb": 11400, "total_rss_kb": 18000, "java_heap_kb": 5400, "native_heap_kb": 3100, "graphics_kb": 1200, "private_other_kb": 700, "system_kb": 1000, "activities": 2, "views": 32, "view_root_impl": 2, "app_contexts": 4, "webviews": 0 } } ] }

Summarize Flutter frame timings

Goal: turn a test's frame timings into numbers you can compare.

  1. Summarize the timings file.

    Record the timings in profile mode first. The summary reads only the file, so it needs no device.

    autonom metrics frames flutter-summary build/integration_response_data.json

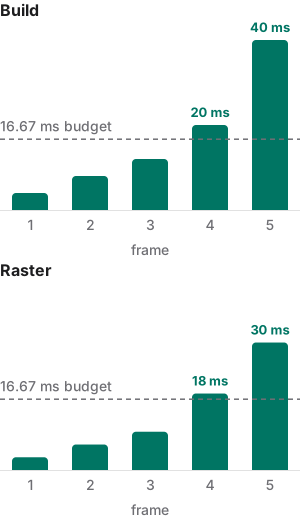
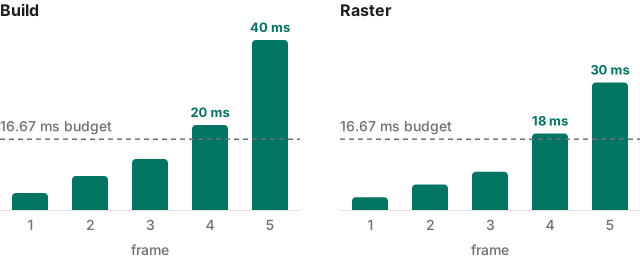
You should see a build lane and a raster lane, each with its worst frame and a count over the 16.67 ms budget.

{ "ok": true, "file": "build/integration_response_data.json", "budget_ms": 16.67, "build": { … "worst_ms": 40.0, "over_budget": 2, … }, "raster": {…} }

What to look at. worst_ms and over_budget in each lane. Build time is work on the UI thread. Raster time is the rasterizer's. Each points at a different fix.

Show full output
{ "ok": true, "file": "build/integration_response_data.json", "budget_ms": 16.67, "build": { "frames": 5, "average_ms": 16.8, "p50_ms": 12.0, "p90_ms": 32.0, "p99_ms": 39.2, "worst_ms": 40.0, "over_budget": 2, "over_budget_percent": 40.0 }, "raster": { "frames": 5, "average_ms": 13.2, "p50_ms": 9.0, "p90_ms": 25.200000000000003, "p99_ms": 29.519999999999996, "worst_ms": 30.0, "over_budget": 2, "over_budget_percent": 40.0 } }
Build times 4, 8, 12, 20 and 40 ms and raster times 3, 6, 9, 18 and 30 ms for five frames, drawn against a 16.67 ms budget line; two bars in each lane cross it. Build times 4, 8, 12, 20 and 40 ms and raster times 3, 6, 9, 18 and 30 ms for five frames, drawn against a 16.67 ms budget line; two bars in each lane cross it.
Two of the five frames run over budget in each lane.

Look for jank on an Android screen

Goal: run a quick frame check on native Android views.

  1. Reset the frame window.

    This starts a fresh count for the session's app.

    autonom metrics frames reset
  2. Drive one flow, then capture.

    Use the same flow every time, so captures compare.

    autonom metrics frames capture
  3. Go deeper only if needed.

    When Android code or a plugin looks slow, sample CPU stacks.

    autonom metrics trace --preset simpleperf --duration 30

Here the test device reports an empty window, as a Flutter app would. You should see zero frames and a no_frames warning.

{ "ok": true, "summary": { "total_frames": 0, … }, … "warnings": [ { "code": "no_frames", "error": "gfxinfo counted 0 HWUI frames for this window, so it has no frame times; the percentile lines it prints then are only its histogram's top bucket and are omitted. Flutter (and other SurfaceView or game-engine renderers) draw outside HWUI, so gfxinfo never sees their frames.", …

What to look at. A Flutter app draws outside Android's view renderer, so gfxinfo counts no frames. For Flutter, use flutter-summary instead.

Show full output
{ "ok": true, "summary": { "total_frames": 0, "janky_frames": 0, "parsed": true, "warnings": [ { "code": "no_frames", "error": "gfxinfo counted 0 HWUI frames for this window, so it has no frame times; the percentile lines it prints then are only its histogram's top bucket and are omitted. Flutter (and other SurfaceView or game-engine renderers) draw outside HWUI, so gfxinfo never sees their frames.", "hint": "For a Flutter app, record frame timings (an integration test's timeline summary or FrameTiming callbacks) and run 'autonom metrics frames flutter-summary <timings.json>'. For native views, drive the UI between 'metrics frames reset' and 'capture'." } ] }, "platform": "android", "target_id": "emulator-5554", "serial": "emulator-5554", "warnings": [ { "code": "no_frames", "error": "gfxinfo counted 0 HWUI frames for this window, so it has no frame times; the percentile lines it prints then are only its histogram's top bucket and are omitted. Flutter (and other SurfaceView or game-engine renderers) draw outside HWUI, so gfxinfo never sees their frames.", "hint": "For a Flutter app, record frame timings (an integration test's timeline summary or FrameTiming callbacks) and run 'autonom metrics frames flutter-summary <timings.json>'. For native views, drive the UI between 'metrics frames reset' and 'capture'." } ], "artifacts": [ "/tmp/autonom-perf/.autonom/sessions/s_…/metrics/…-frames-gfxinfo.txt" ] }

Find out which traces this target can record

Goal: pick a trace before you spend 30 seconds recording it.

  1. List the presets.

    It checks the target and the tools on this machine.

    autonom metrics list-presets

You should see each preset, whether it can run here and, if not, why.

{ "ok": true, "platform": "android", "presets": [ { "id": "simpleperf", "available": true, … "id": "allocations", "available": false, "reason": "ios_only", …

What to look at. available and reason. On Android the Instruments presets are ios_only. On the iOS Simulator, hitches is unsupported.

Show full output
{ "ok": true, "platform": "android", "presets": [ { "id": "simpleperf", "available": true, "tool": "adb" }, { "id": "gfxinfo-flow", "available": true, "tool": "adb" }, { "id": "allocations", "available": false, "reason": "ios_only", "tool": "xctrace" }, { "id": "time-profiler", "available": false, "reason": "ios_only", "tool": "xctrace" }, { "id": "leaks", "available": false, "reason": "ios_only", "tool": "xctrace" }, { "id": "hitches", "available": false, "reason": "ios_only", "tool": "xctrace" } ], "tools": { "adb": true, "xctrace": true, "ps": true, "du": true } }
Reproduce these outputs

From the root of an Autonom d0f7211 checkout, in bash or zsh. Autonom's test device stands in for an emulator, and fake tells it which fixture to answer a dumpsys call with, so no device is needed. Session ids and times differ on every run. The tools block of list-presets reflects the machine it runs on.

S=$PWD W=/tmp/autonom-perf rm -rf $W && mkdir -p $W/app/build && cd $W/app export AUTONOM_HOME=$W/.autonom AUTONOM_FAKE_STATE=$W/fake-state.json echo '{"pidof": {"com.example.app": "4242"}}' > $AUTONOM_FAKE_STATE fake() { python3 -c 'import json,os,sys; p=os.environ["AUTONOM_FAKE_STATE"]; s=json.load(open(p)); s[sys.argv[1]]=open(sys.argv[2]).read(); json.dump(s,open(p,"w"))' "$@"; } autonom() { python3 $S/scripts/autonom.py --platform android --serial emulator-5554 --adb $S/tests/fakes/fake_adb.py "$@"; } autonom session start --app-id com.example.app cp $S/tests/fixtures/frame_timings.json build/integration_response_data.json autonom metrics frames flutter-summary build/integration_response_data.json autonom metrics list-presets fake dumpsys_meminfo $S/tests/fixtures/meminfo-1.txt autonom metrics snapshot --label baseline for i in 1 2 3; do fake dumpsys_meminfo $S/tests/fixtures/meminfo-$i.txt; autonom metrics memory capture --label after-flow; sleep 1; done autonom metrics memory analyze printf 'Stats since: 1\nTotal frames rendered: 0\nJanky frames: 0 (0.00%%)\n' > gfxinfo.txt fake dumpsys_gfxinfo gfxinfo.txt autonom metrics frames reset autonom metrics frames capture

Good to know

  • A lead is a direction, not a leak. Prove a retained path with a heap dump or Instruments before you patch anything.
  • A lead needs a pattern. analyze needs at least three samples, a rising trend and few drops. The growth must also reach --min-growth-kb, 1024 KB by default.
  • Android and iOS numbers do not compare. Android's total_pss_kb and iOS's rss_bytes measure different things. Each snapshot's metric_semantics says which one you have.
  • Measure Flutter in profile mode. Debug timings are not representative. Name the device, and treat emulator results as a direction only.
  • CPU is a percentage of one core. A process busy on two cores reads 200. A reading that is too old carries a cpu_stale warning.
  • Compare only like with like. Record the device, OS version, refresh rate, build mode, data state, thermal state, the exact flow and the number of runs.
  • Fix the reference that holds on. Forced garbage collection or a cleared cache only hides a leak. Repeat the same flow after the fix.

Reference

Each command measures the session's target, except flutter-summary, which reads a file.

CommandWhat it does
autonom metrics snapshotMemory and CPU at one moment. --label names the saved files.
autonom metrics seriesSeveral snapshots in a row, with the trend and any growth leads. --count and --interval set the pace.
autonom metrics memory captureAndroid: meminfo, process status, gfxinfo and a heap dump. --no-hprof skips the heap dump, for builds that cannot make one.
autonom metrics memory analyzeGrowth leads across the captures. --min-growth-kb sets the threshold.
autonom metrics memory warniOS Simulator: sends a memory warning. It does not check how the app reacts.
autonom metrics frames resetAndroid: starts a fresh frame window for the app.
autonom metrics frames captureReads the window back, with a summary and the raw text.
autonom metrics frames flutter-summary <file>Build and raster times from a Flutter timings file. --budget-ms sets the frame budget.
autonom metrics trace --presetRecords a trace with the named preset. --duration sets its length in seconds.
autonom metrics list-presetsThe presets this target can record, and why the others cannot.

Android and iOS differences

The iOS Simulator runs on your Mac, so several numbers come from the Mac, not from a device.

MeasureAndroidiOS Simulator
Memory snapshotmeminfo and /procThe Mac's ps and the container size
Memory capture and heap dumpYesNo: memory warn as a stimulus, and the allocations trace
Frame statsgfxinfo reset and captureNo: use flutter-summary or the time-profiler trace
Tracessimpleperf and gfxinfo-flowInstruments: allocations, time-profiler and leaks; the Simulator refuses hitches
CPU samplingSimpleperf counts CPU cycles where the device offers them. An emulator has no such counters, so it samples the CPU clock.No Simpleperf: use the time-profiler trace
  • The Flutter VM Service, for the widget tree and the Dart heap, is not shipped. The Flutter skills use DevTools in profile mode instead.
  • Startup time and app size are separate claims from frame timings. Report them separately.

Next steps

You can measure the app and tell a growth lead from a leak.